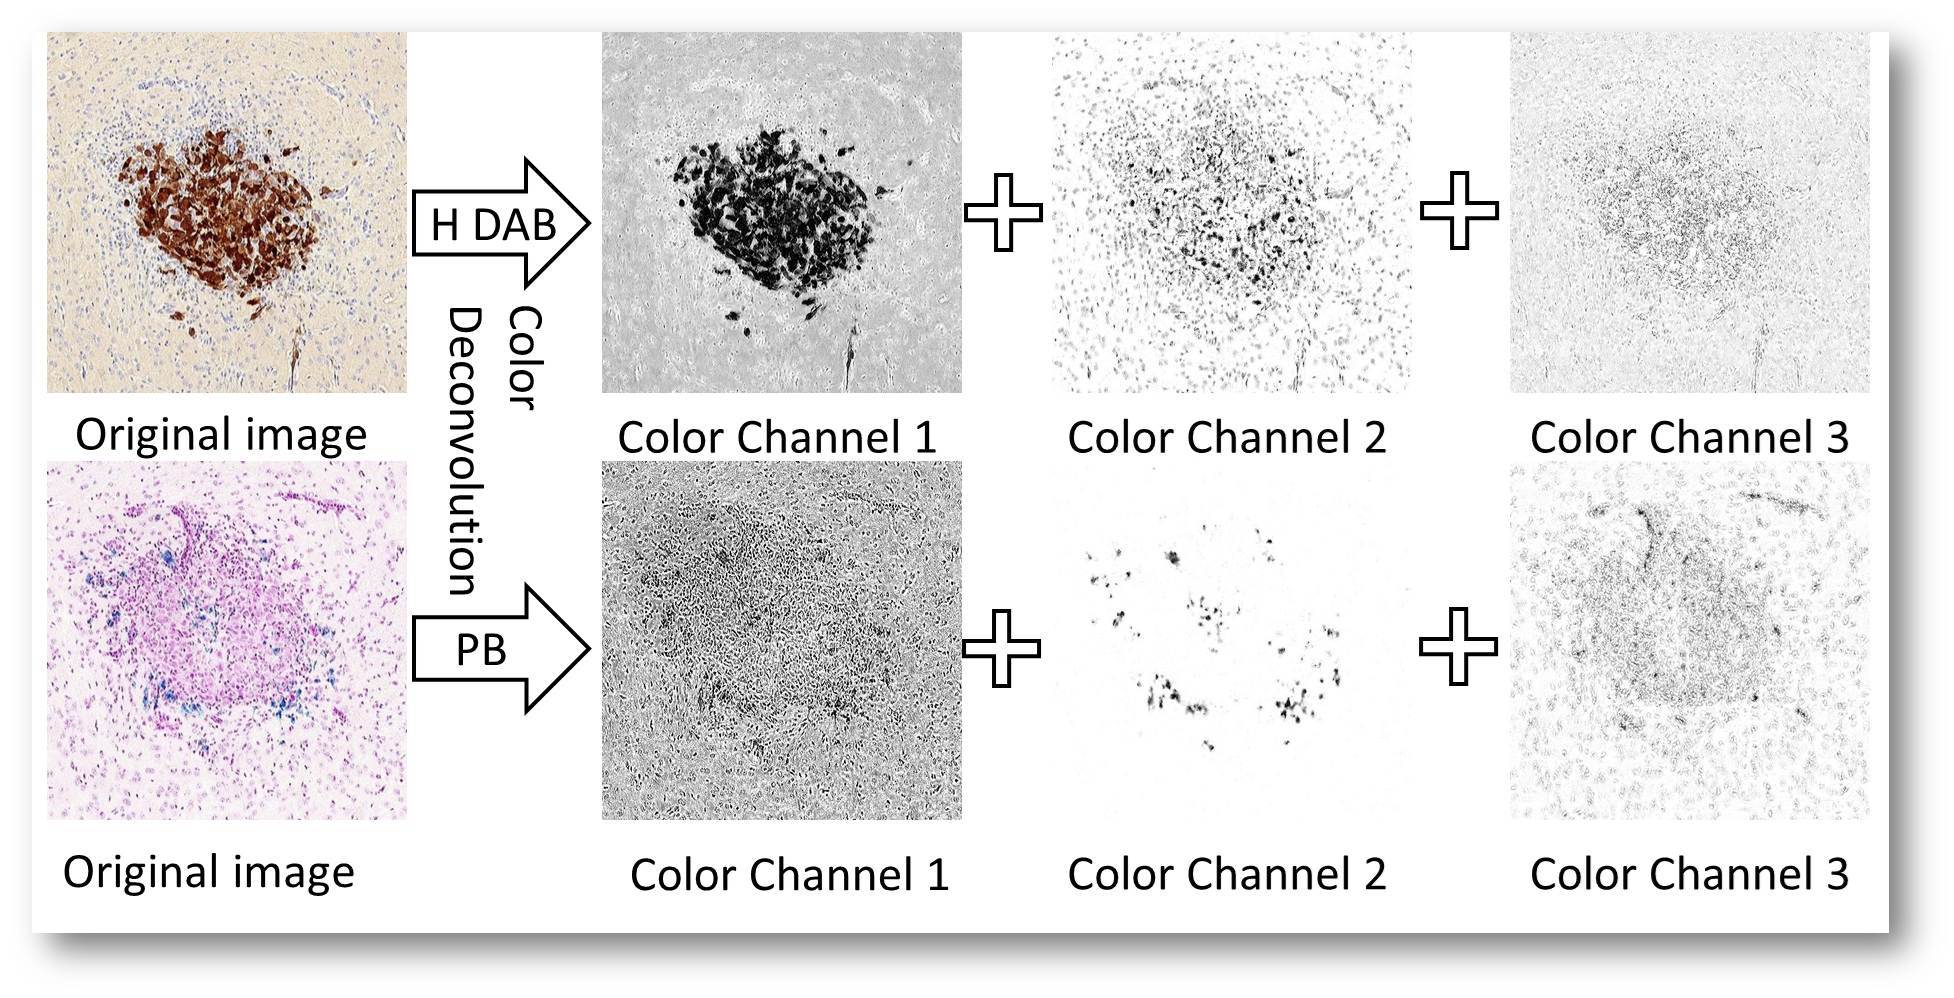
1.Color channel analysis( in V1.2) in V1.2)
The cellular image can be converted into different color channels using color-deconvolution algrithom.
V1.2 includes:
(1)RGB channel,
(2)gray channel,
(3)H&E(Haematoxlin and Eosin) channel,
(4)H DAB (Haematoxylin and DAB) channle,
(5)PB (pure blue) channel.
|
 |
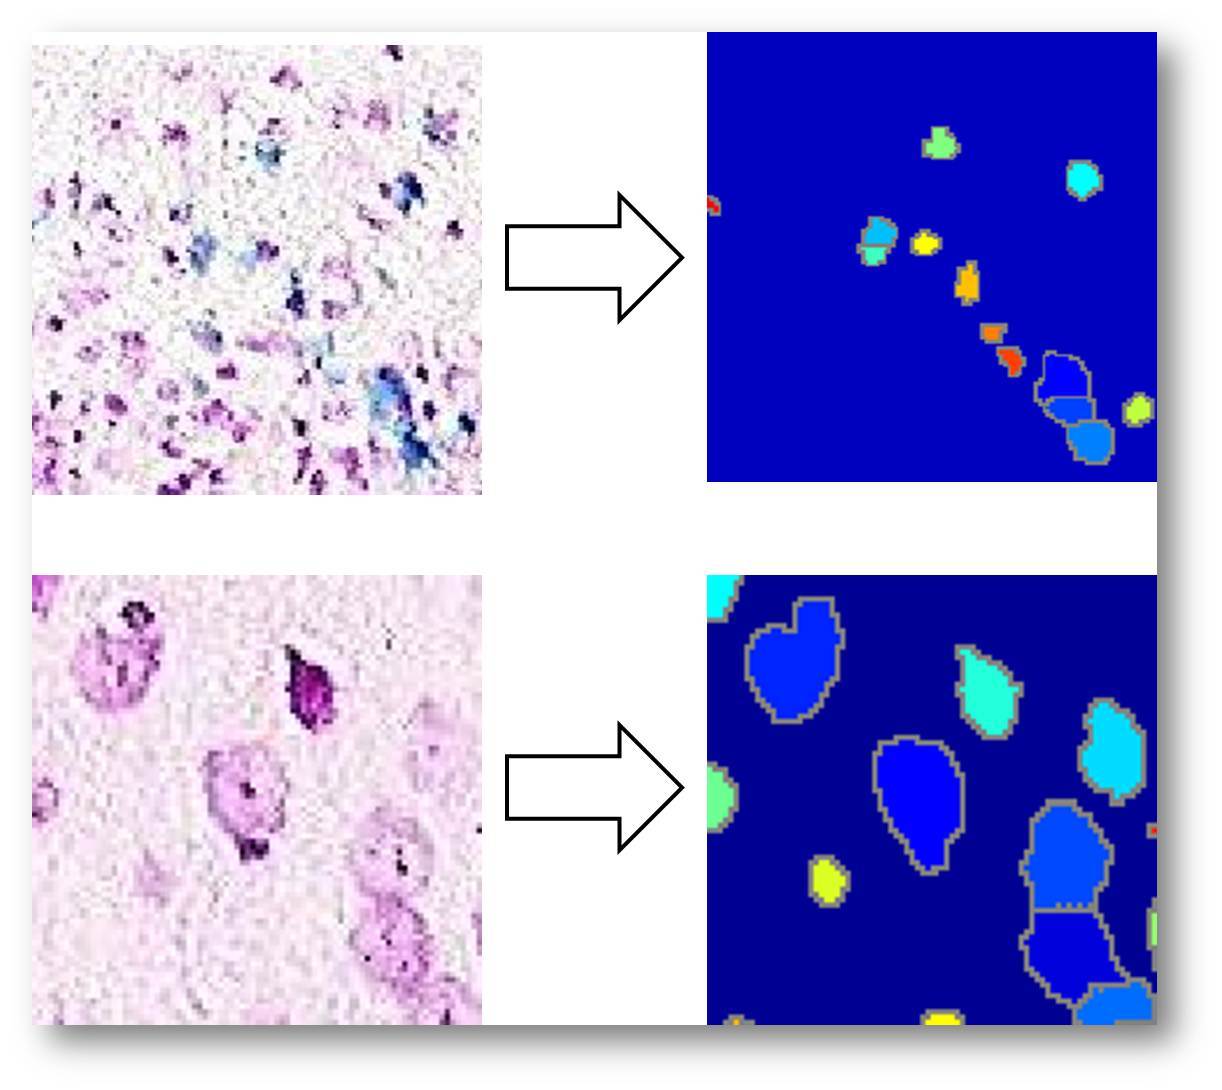
2.Individual cell recognition( in V1.2)
The individual cell is identified using watershed algorithm. The cells can be recognized even with slight overlap.
|
 |
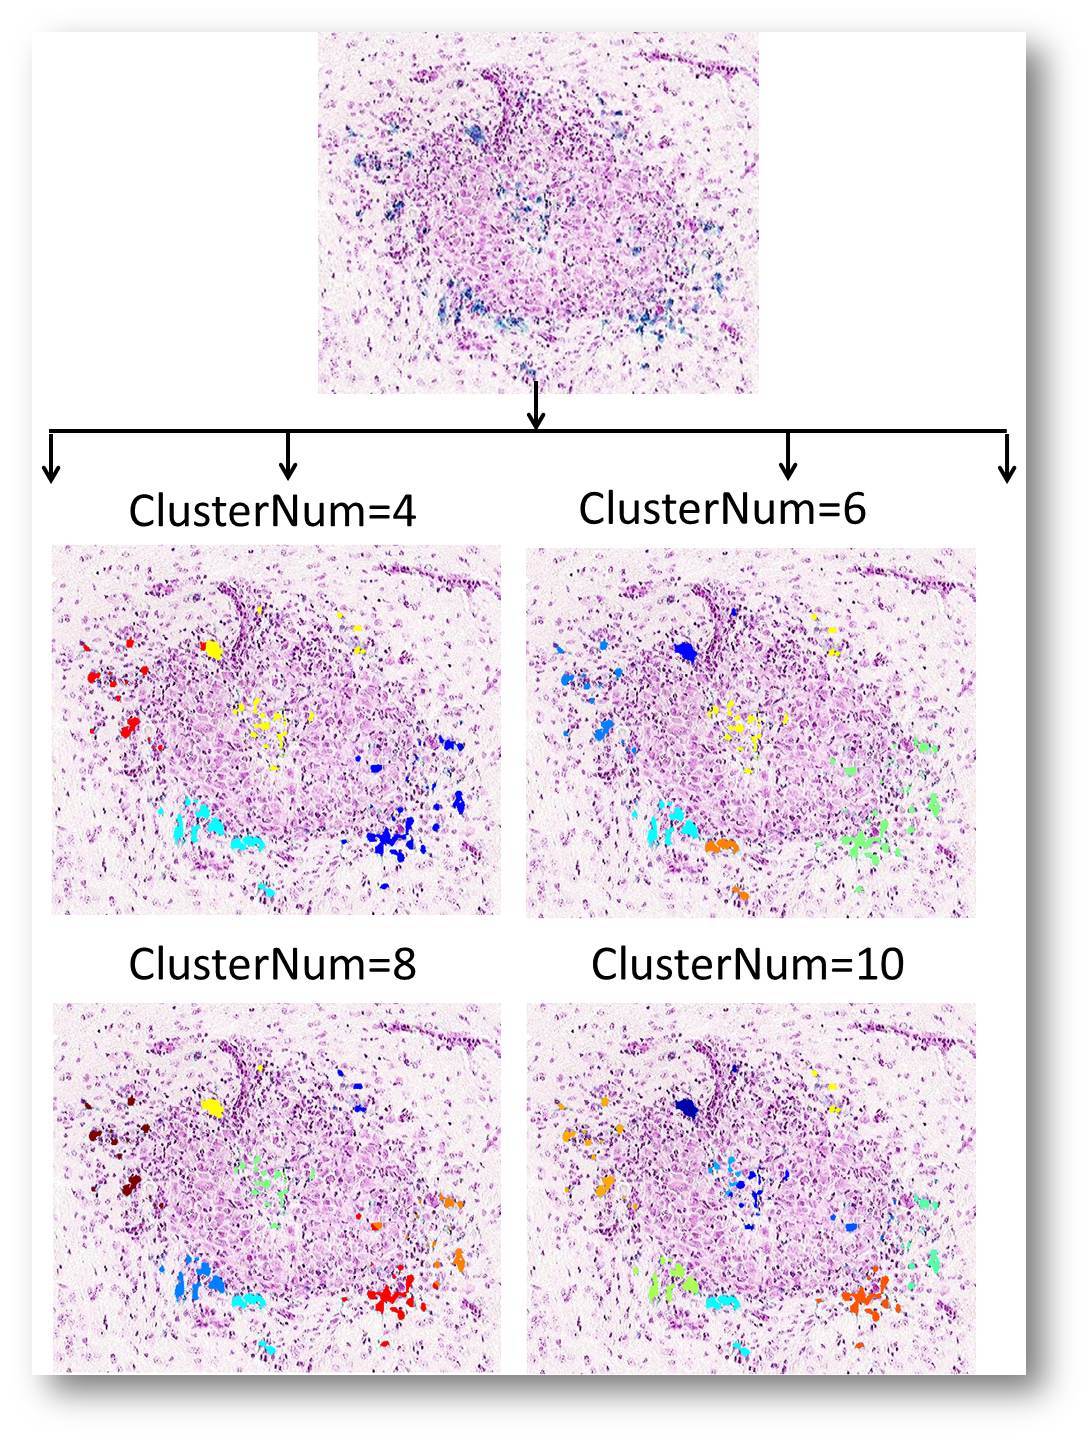
3.Spatial pattern cluster analysis( in V1.2)
Automatic clustering technique is adopted in CellPie to evaluate the distribution features based on their spatial positions.
|
 |
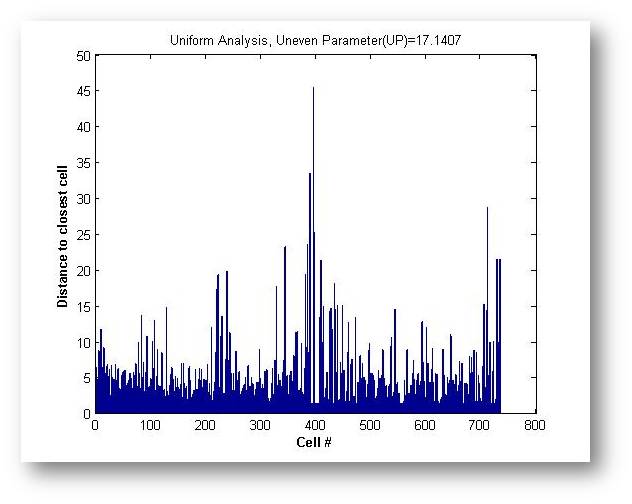
4.Uniformity evaluation( in V1.2)
The uniform level of the cell distribution is an important parameter to assess the spatial pattern. In CellPie, an uneven parameter (UP) is calculated to evaluate how uniform the cells distribute.
|
 |
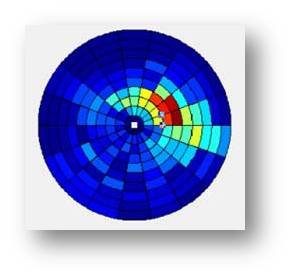
5.Pie Structure
A Pie structure is designed to display the spatial distribution of target cells.
|
 |
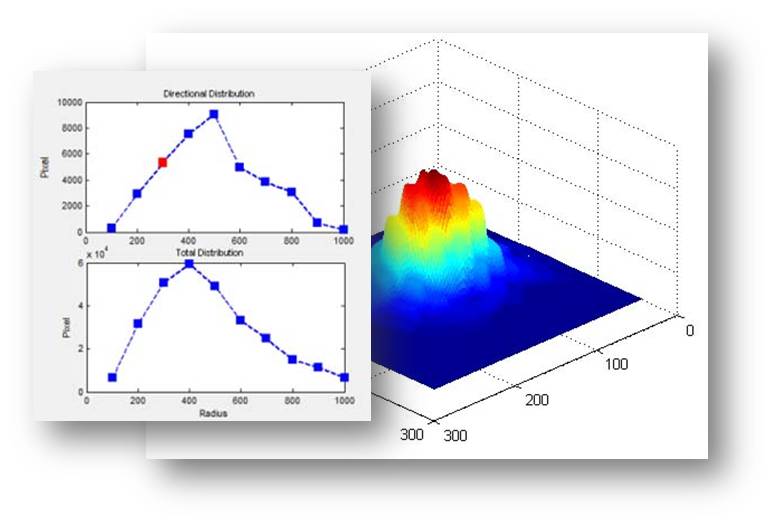
6. Visulization of pie data
Click any plot of the Pie structure, the spatial distribution along that direction will be plotted. The current region be selected on the pie will be highlighted.
The pie structure also can be visulized in 3D model.
|
 |
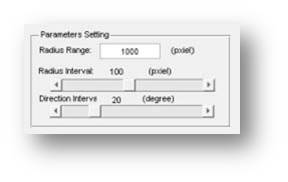
7. Flexiable on pie defination
The Pie structure can be custermized by different range, stepsize, direction intervals, which allow a flexable visulization on cell distributions.
|
 |
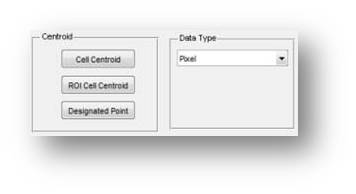
8.The Centroid definition
The centroid of the Pie structure can be defined by automatical or interactive methods. Including the automatically decised by segemented cells, Centroid of a ROI region and drawed by hand.
|
 |