Kidney Compartments Segmentation
It’s a two-stage method. The kidney mask was extracted with threshold and morphological operation, then clustering is performed in a constructed physiological feature space by FCM. |
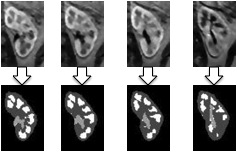
Kidney MaskIn the first step, we employed the max-mean subtraction method to maximize the coverage of the inner kidney tissues. Based on the assumption that gadolinium passes through most of the kidney compartments, maximum intensities were selected along the temporal dimension. Using the pre-contrast baseline, a difference image was binarized using Otus threshold. Finally, inner holes and outer scraps were modified by a morphologic operation. The maximum connected region in hole-filled image was selected to represent the kidney mask. Physiological feature spaceThe major advantage of dynamic MRU data is the ability to make functional assessments in addition to tissue structural observations. The concentrations of gadolinium in the kidney cortex, medulla and cavities regions vary with time according to their expected physiological functions. These physiological differences are the essential criterion to distinguish compartments in the kidney.
The time intensity curves(TIC)were utilized to extract physiological parameters, which included glomerular filtration rate(GFR), different renal function(DRF), renal blood flow(RBF), mean transit time(MTT), renal transit time(RTT), and renal volume distribution(RVD). However, these parameters can only be used to evaluate the kidney overall. For inner kidney segmentation, we needed to consider the pixel-by-pixel parameters associated with physiological units. In this preliminary research, three parameters are selected as following. (1)Time to Peak (TTP) The initial time that contrast agent appears is a significant parameter for distinguishing different compartments and has been used as a threshold in previous study. Time to peak is also a common parameter utilized in radionuclide MAG3 scintigraphy, which accounts for the time to maximum counts. For the variation exists throughout the enhanced course, we measured the time to peak phase instead of the maximum peak signal intensity value. Thus, TIP(x)=argmin(t) when SI(x)> Tp and Tp is defined as certain fraction of maximum intensity. (2)Peak Concentration(PC) The MRU experiments also showed that the maximum concentration was different in renal compartments. Due to the existence of volume fraction and flow I/O speed between tissues (e.g. filtration and excretion), the maximum concentration tend to be different. Considering the linear relationship between concentration and signal intensity in low dose, peak concentration can be simply represented as peak intensity. (3)Renal Perfusion (RP) Renal perfusion is an important cortical parameter, which is used to help diagnose the renal artery stenosis and dysfunction. With the up-slope model, renal perfusion is proportional to the maximum slope of the initial cortical perfusion curve. Since both the TIP and PC are significantly different in the renal cavity and parenchyma, the challenge of segmentation mainly lies in the separation cortex from medulla. Therefore, the renal perfusion was also derived here to compose the feature space. Based on the up-slope model, we simplified the renal perfusion of pixel to the maximization gradient in the early phase. Compartment SeparationUsing the parameters described above, a physiological feature spacewas constructed. The dimensionwas decided by the number of selected features. Each TIC of each pixel was mapped into the new feature vector.Thus, the segmentation of kidney was equal to a pattern recognition problem in the new feature space. To group the similar samples, a fuzzy c mean method(FCM) was selected instead of a c-mean method for the more stable experimental results. Reference-YangTang, Hollie Jackson, Roger De Filippo, Susan Lee, Marvin D. Nelson, Rex A. Moats, Renal Segmentation in physiological feature space with dynamic contrast enhanced MR Urography: Preliminary research, SPIE sixth international symposium on multispectral image processing and pattern recognition (MIPPR2009),Oct30-Nov1, Hubei,China. |
